How do you analyse power meter data?

Once the preserve of the professional elite, the power meter is now used by a large number of amateur cyclists. It has become an essential tool that enables quality training and precise performance tracking.
Your power meter collects usable data during and after your ride. This information is invaluable for assessing your effort, identifying your areas of improvement and building your training plan. Probikeshop explains how to analyse the data from your power meter.
A few reminders about power meters
A power meter is a valuable tool for cyclists looking to improve. Specialist brands are offering increasingly affordable models.
Choosing your power meter
There are several types of power meter:
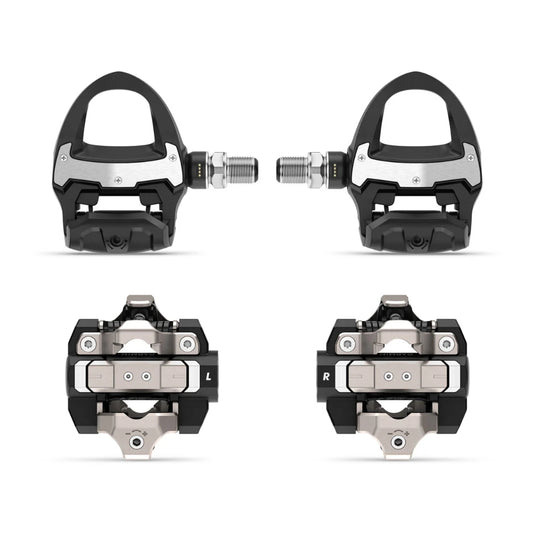
Cost and measurement accuracy are the main selection criteria to consider. Pedal and crankset sensors have the advantage of providing separate measurements for the right and left leg. With this data, you can detect and correct any imbalance in your pedalling cycle.
The benefits of the power meter
Your power meter allows you to know instantly the power you are producing during your effort. The power data is expressed in watts (W) and calculated with every pedal stroke.
Power is a raw piece of data that expresses the cyclist's performance level without any interference. It is preferred over heart rate as a reference metric for measuring training load and effort intensity. The combined analysis of power and heart rate is very valuable for gauging form and fatigue.
During and after a cycling ride, your power meter is used to:
How do you train with a power meter?
Your power meter is properly calibrated — you can start training and discover all the benefits of this new tool.
Determining your rider profile
The first step is to run some tests to assess your physical potential. Your power meter allows you to establish your "rider profile" (peak power record or PPR). The aim is to collect reference power outputs over efforts of 5, 10 and 30 seconds, and over 1, 5, 20 and 60 minutes… By linking a wattage value to an effort duration, this PPR highlights your strengths and weaknesses. It also helps you track your progress throughout the season.
After a proper warm-up, here are the tests you can carry out with your power meter:
From the data collected, complete your power profile. Don't forget to weigh yourself before carrying out these tests, so you can relate the recorded power data to your weight (expressed as W/kg). This power-to-weight ratio is key to understanding your potential in the mountains. For example: a 62 kg cyclist who produces 320 W at threshold (5.1 W/kg) will be a better climber than a 78 kg cyclist who produces the same power (4.1 W/kg).
Targeting your training intensities
From the initial data provided by the power meter, notably the MAP, you can identify your intensity zones. These correspond to the different effort levels you can sustain during training. The ESIE scale ("Subjective Estimation of Effort Intensity") by Frédéric Grappe classifies and describes 7 intensity zones, indicating a percentage of MAP and HR for each one. You simply need to calculate your target power for each intensity, based on your MAP, to make the following table your own.
The ESIE scale by Frédéric Grappe, based on HR and MAP:
| Intensity zone (exercise duration) | Max HR | MAP | Perceived exertion |
|---|---|---|---|
|
i1 - Light intensity / Recovery (several hours) |
< 75 % |
40 - 50% MAP |
No muscle pain Very easy conversation Exhaustion after several hours |
|
i2 - Moderate intensity / Base endurance (several hours) |
75 - 85 % |
50 - 60% MAP |
No muscle pain Easy conversation Exhaustion after 3 - 4 hours |
|
i3 - Sustained intensity / Tempo (1-2 hours) |
85 - 92 % |
60 - 70% MAP |
Muscle pain increases + Laboured conversation Exhaustion after 2 hours |
|
i4 - Anaerobic threshold intensity (20-60 minutes) |
92 - 96 % |
75 - 80% MAP |
Muscle pain increases ++ Difficult conversation Significant exhaustion after 20' |
|
i5 - Supra-maximal intensity / MAP (5-10 minutes) |
96 - 100 % |
100% MAP |
Muscle pain increases +++ Very difficult conversation Complete exhaustion between 5 and 10' |
|
i6 - Sub-maximal intensity / Lactic anaerobic power (30-120 seconds) |
100 % |
1.5 x MAP |
Significant nervous fatigue Maximum muscle pain Impossible to hold a conversation |
|
i7 - Maximal intensity / Alactic anaerobic power (< 7 seconds) |
90 - 95 % |
2.5 x MAP |
Very significant nervous fatigue No muscle pain Feeling of exercising while holding your breath |
The power meter helps you precisely target the right zones during training. This precision in measuring effort makes it possible to plan quality sessions. The training plan becomes more effective because it can schedule the necessary workloads at the right time and for the right duration.
Some tips for making the most of your power meter
Once your power profile has been established and your intensity zones have been calibrated, you will carry out your training exercises. For example: if you need to perform a threshold effort (intensity 4) with a 4 x 5' repetition, you will try to stay as stable as possible around your threshold power.
Analysing power meter data
The usefulness of your power meter is not limited to the duration of your ride or race. By uploading your activity for the day, you can analyse the recorded data in depth.
Analysing data on a cycling training app
There are several training apps, such as Strava or Garmin Connect, which offer simplified analysis of your rides. These tools provide more or less advanced features (some modules require a paid subscription). Sites such as Training Peaks or Nolio provide particularly detailed data to optimise your training.
First of all, you will find all the figures you need to establish your power profile (max power, MAP, threshold…). They help you identify your strengths and define the races that suit you. For example: a rider who excels over 30" has punching qualities, while a cyclist who performs well over 20' is strong in time trials. This PPR helps you choose your areas of improvement and direct your training accordingly. If you want to perform at a high level, it is more worthwhile to specialise in your preferred discipline.
Note that using the power meter in a race is an excellent way to update your PPR, as record power outputs are often produced in competition.
Useful data for planning training
After each session, the data from your power meter allows you to analyse your effort for the day. You can check whether you have correctly respected the planned intensity zones. You can continue the analysis by cross-referencing the power curve with your heart rate and cadence.
Over the longer term, all the recorded data is useful for measuring your workload and planning your training. The power produced during a session can be used to calculate a Training Stress Score (TSS). This TSS is measured from your intensities: the harder you ride on a given outing, the higher the TSS value. This allows you to manage your workload more precisely and better control your fatigue. The idea is to plan a progressive build-up in order to arrive in peak form at the right moment.
Découvrez tous nos conseils & Tutoriels
ROAD - Power Meters
-

GARMIN RALLY RS 210 Power Meter Pedals
Regular price 799,90 €Regular priceUnit price per -

FAVERO ASSIOMA PRO RL-2 Power Meter Pedals
Regular price 693,60 €Regular priceUnit price per -

FAVERO ASSIOMA PRO RL-1 Power Meter Pedals
Regular price 435,60 €Regular priceUnit price per -

GARMIN RALLY RS 110 Power Meter Pedals
Regular price 499,90 €Regular priceUnit price per -

Pedals Power Meter GARMIN RALLY RK 110
Regular price 479,90 €Regular priceUnit price per -

Pedals Power Meter GARMIN RALLY RK 210
Regular price 799,90 €Regular priceUnit price per -
FAVERO ASSIOMA DUO Power Meter Pedals
Regular price 449,90 €Regular priceUnit price per -

GARMIN RALLY RS/XC 210 Power Meter Pedal Kit
Regular price 1.099,90 €Regular priceUnit price per


